News >

TelevisaUnivison Partners With Omnicom for Hispanic Household Data Graph
By Mollie Cahillane, Adweek
Omnicom Media Group will be the first agency to team up with TelevisaUnivision to leverage its Hispanic household data graph.
Top line
The data graph will integrate with OMG’s identity solution, Omni ID, through a privacy-oriented clean room technology and work to power its targeting, optimization and measurement for always on activation across the entirety of its brands.
Between the lines
The company believes that the data will allow brands to expand reach and resonance with the U.S. Hispanic population.
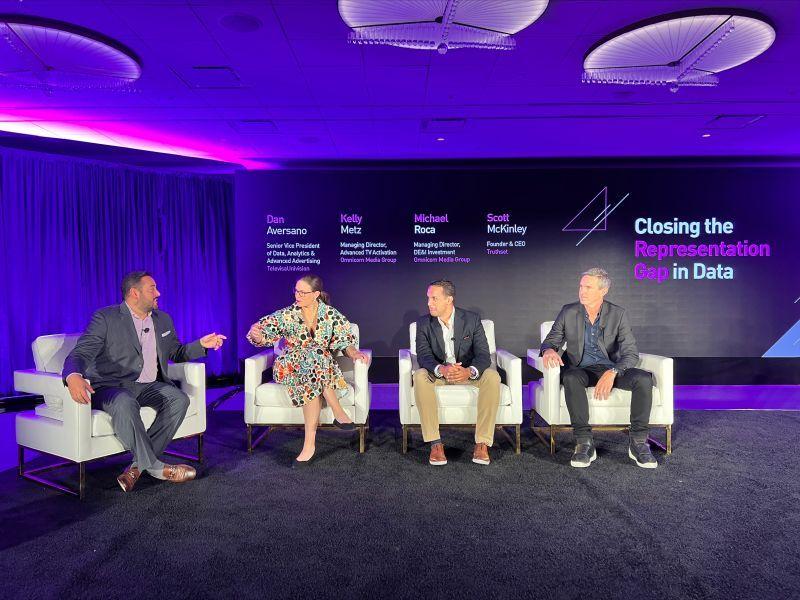
“At launch we were clear that TelevisaUnivision’s Hispanic household data graph was built for activation, and this partnership with OMG is a critical milestone underpinning our steadfast commitment to ensuring data is inclusive and representative of diverse audiences,” said Dan Aversano, svp of data, analytics and advanced advertising at TelevisaUnivision, in a statement. “By integrating TelevisaUnivision’s data graph into Omni ID, we’re confident that OMG’s vast roster of clients will be able to engage U.S. Hispanics in a more effective way that will drive meaningful business results and ROI.”
The groups made the announcement during TelevisaUnivison’s annual Leading the Change conference on Thursday.
“OMG saw a clear opportunity to leverage the great work TelevisaUnivision has done to improve representation and coverage of the U.S. Hispanic community with their identity graph,” said Kelly Metz, North America managing director, advanced TV at Omnicom Media Group, in a statement. “Enabling this advanced identity solution via Omni ID translates to a powerful first-mover opportunity for Omnicom clients and another critical component of how OMG lays the foundation for a solid approach in manifesting diversity in the media process, work, and investment.”
Bottom line
TelevisaUnivision’s Hispanic household data graph covers nearly 100% of U.S. Hispanic households, and works to close the gap in representation in measurement. The data graph drove 100% growth in audience revenue, and customer content and sponsorships, especially through digital and social channels during the company’s upfront this year.


